




By: Heather Porter, Senior writer
Illustrations: Kevin Walters
Updated: November 17, 2025, 10:05 a.m. EST

If you’re a single mom, the right zip code can offer breathing room, steady ground, and even a real fresh start. But when you’re already spinning more plates than you thought possible, where do you find the time to thoroughly compare possible landing spots?
The past year has tested families with high rents, scarce child care slots, and uneven access to safe neighborhoods and strong schools. For single moms, who carry both the caregiving and the income load, the right community can mean the difference between constant strain and real stability. Even in calmer times, raising kids alone is a complex job. Budgets are tight, schedules are fragile, and tradeoffs pile up.
With this approach, we compared all 50 states and D.C., along with the country’s major metro areas, to highlight where a single mom can pay the bills, find care, feel safe, and plan ahead, and where the math still does not work. The analysis explores rent burden, child care prices and program availability, transportation and food costs, unemployment, crime, health care access for kids and mothers, and K–12 outcomes. Each factor is normalized and rolled into a single score.
Key takeaways
- Worcester, Minneapolis–St. Paul, and Omaha are the top metros for single moms. Each of which pairs manageable housing costs with strong schools and accessible care.
- Vermont, Maryland, and both Dakotas rank as the best states for single mothers. All three combine lighter rent burdens, solid child care ecosystems, and low unemployment.
- California, Nevada, and New Mexico are the toughest states, where steep housing, child care costs, and safety gaps outweigh strengths elsewhere.
- Not all “cheap” places are easy: some Southern metros and states pair low child care prices with weaker safety or school outcomes, creating tradeoffs families feel day to day.
- Big coastal markets often underperform for single moms once rent and child care are counted, even with strong wages and hospitals.
The Best Metro Areas for Single Mothers
Worcester takes the top spot with a rare combination of strong education results and broad child care program availability, so a single mom is less likely to spend months on a waitlist while juggling work. Minneapolis–St. Paul follows with one of the lightest rent burdens among big metros and consistently strong school performance, a pairing that frees up both money and mental bandwidth. Omaha rounds out the top three by matching low unemployment with safer neighborhoods, the kind of day-to-day calm that makes solo parenting feel possible, even if health care access requires a little more planning.
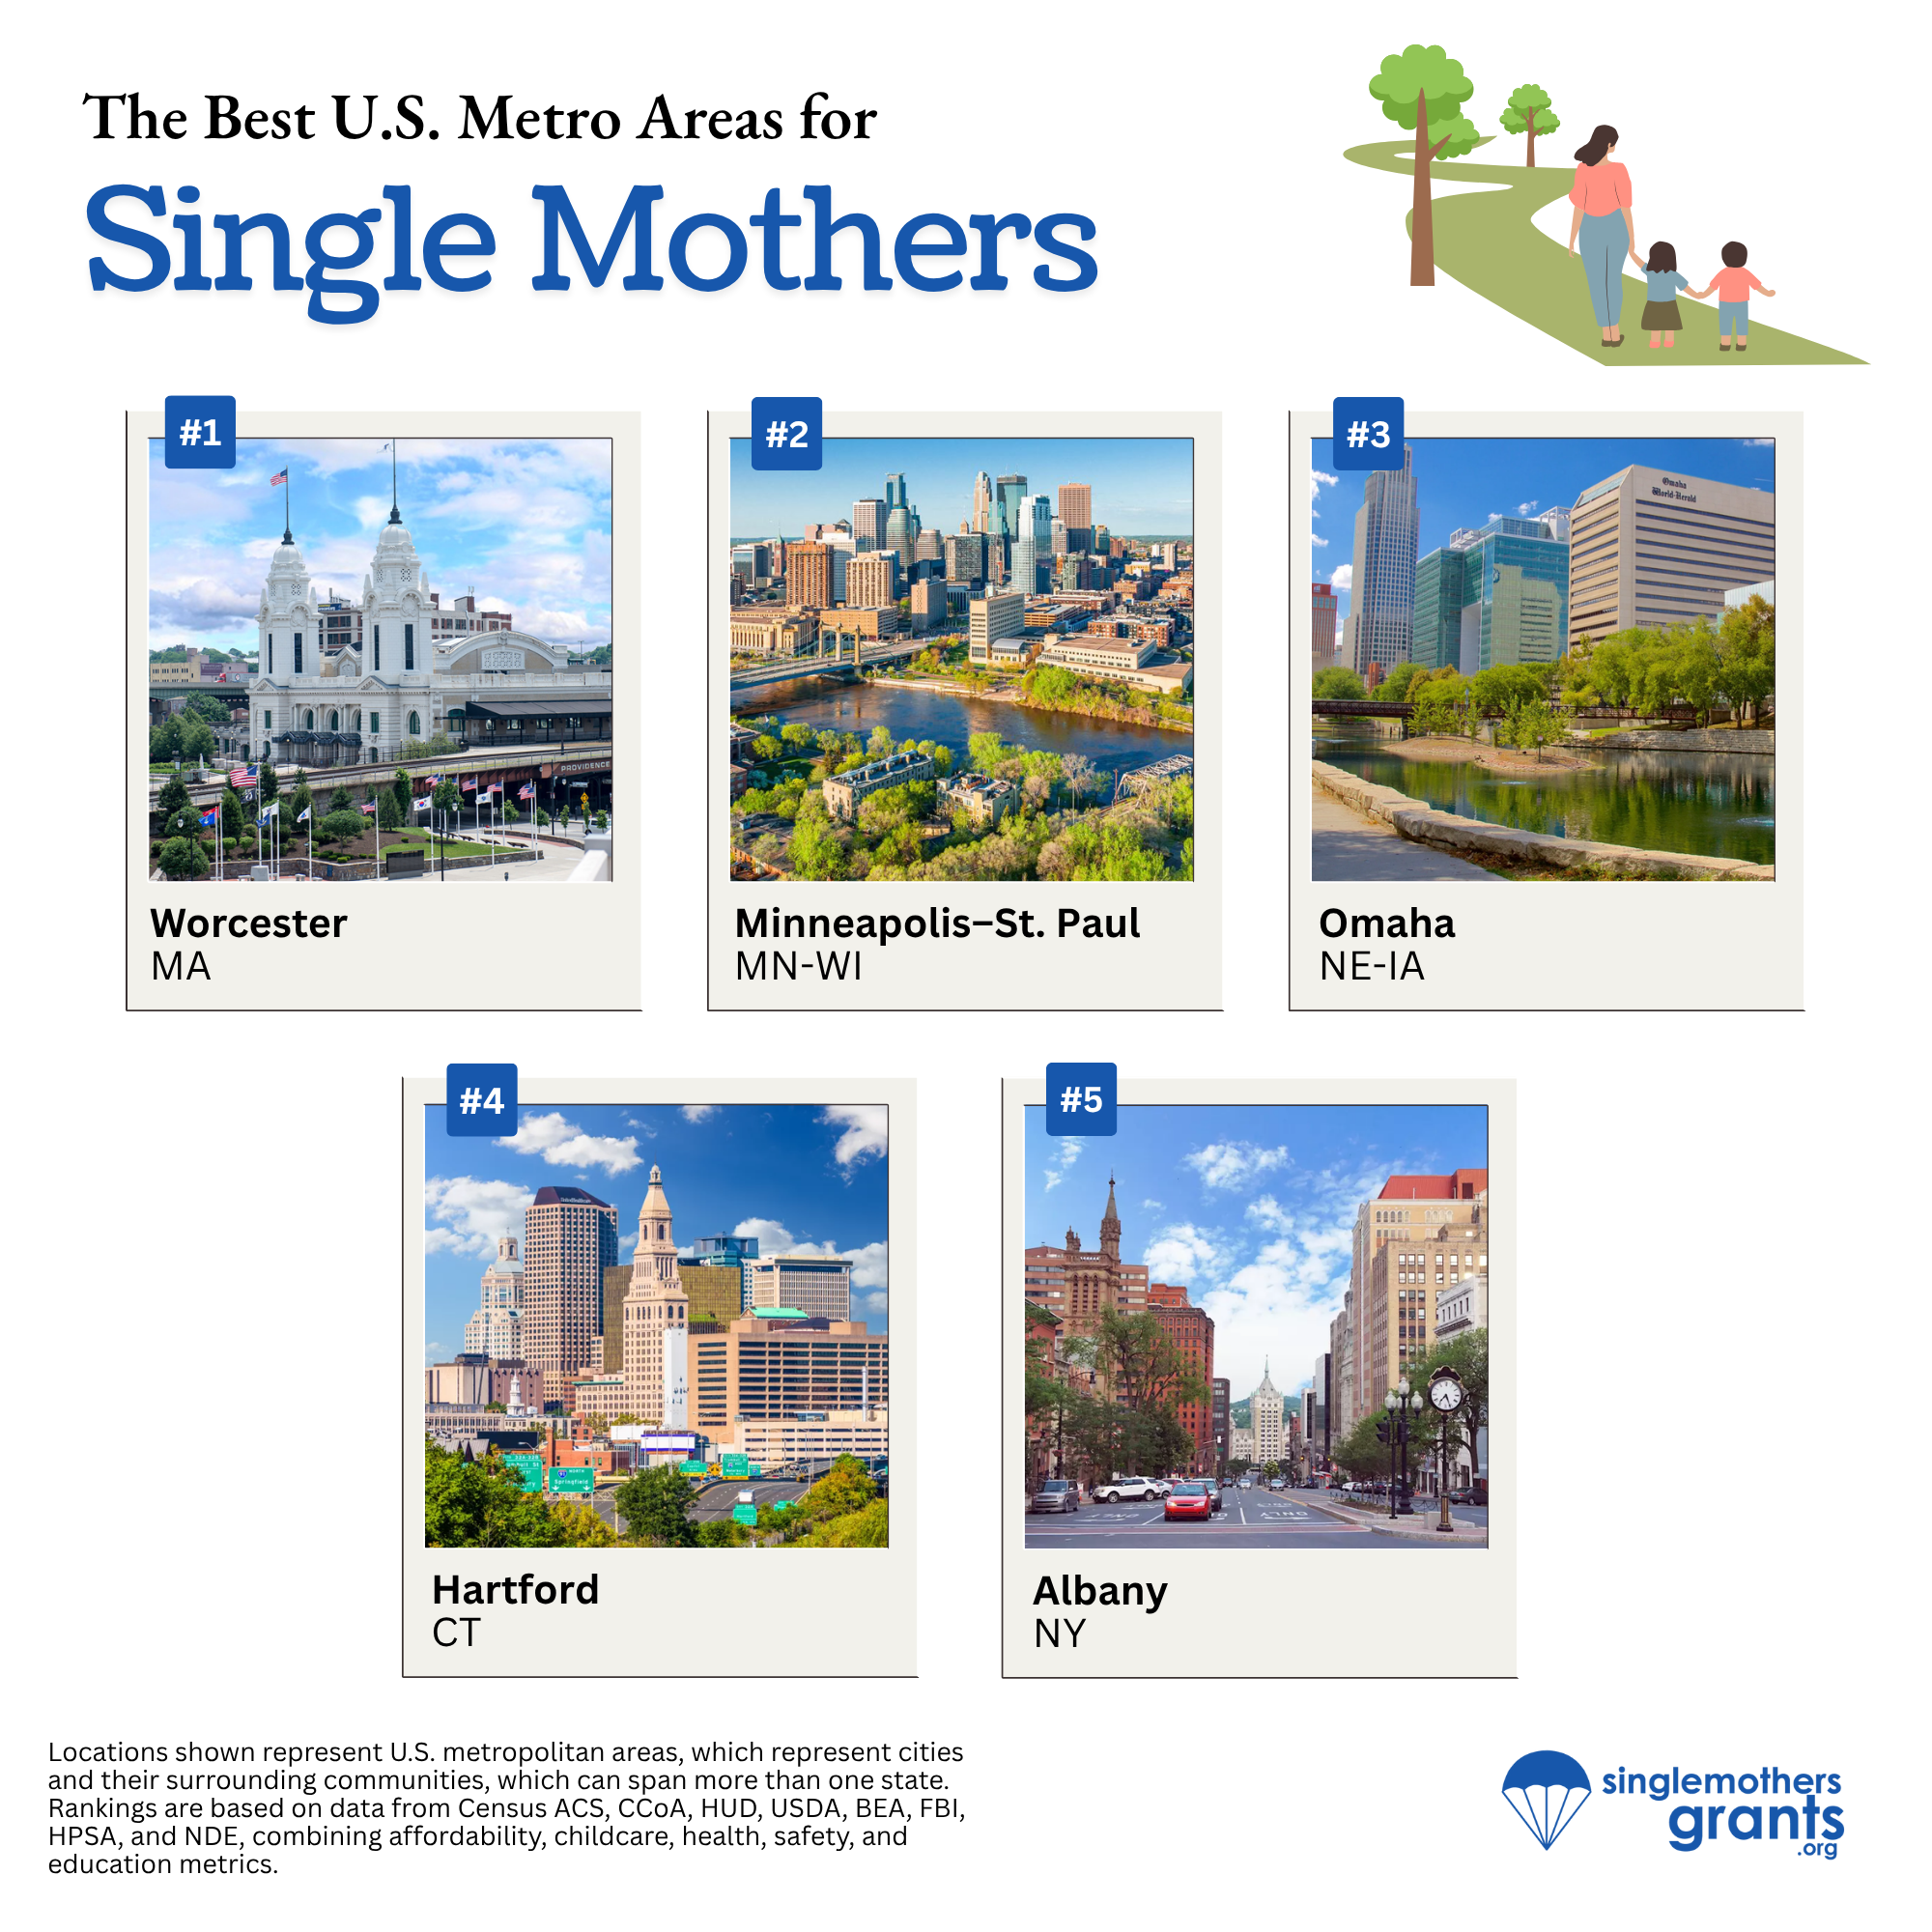
Hartford and Albany complete the top five, each punching above their weight on overall rent burden, which shows up as more predictable monthly budgets. At the other end of the list, the story is cost pressure. San Francisco, San Jose, Los Angeles, and San Diego all benefit from excellent transportation and top hospital systems, but those advantages are dwarfed by sky-high rents and steep child care bills that can swallow a single paycheck. Las Vegas lands near the bottom for a different mix. The city has moderate rents but weaker safety and health access, so the daily tradeoffs stack up in other ways.
Several single-category standouts are worth highlighting because they can shape a family’s experience even if the overall rank is middling. Albany and Buffalo lead on rent burden, a major relief valve for single-income budgets, while Washington, D.C. tops health care access thanks to dense provider networks. On child care affordability, El Paso and San Antonio are among the most palatable, though their overall rankings are held back by other costs and service gaps. The bottom line is that metro “fit” depends on which lever matters most for your household, whether that’s rent flexibility, a confirmed child care slot, a short commute, or a safer block near a good school.
The Top Metros for Moms Going it Alone
States Where Single Moms Can Shine
At the state level, the leaders share a familiar pattern. Vermont, North Dakota, South Dakota, Maine, and Nebraska keep the biggest bills predictable, so a single paycheck stretches further. Rent takes a smaller bite, jobs are steadier, and child care is either cheaper or easier to find. Safety and schools tend to be more dependable, which lowers the daily temperature for solo parents. The Upper Midwest and Northern New England especially stand out for that balance of affordability, calm, and basic supports that show up as shorter waitlists, fewer surprise expenses, and neighborhoods that feel manageable with kids in tow.
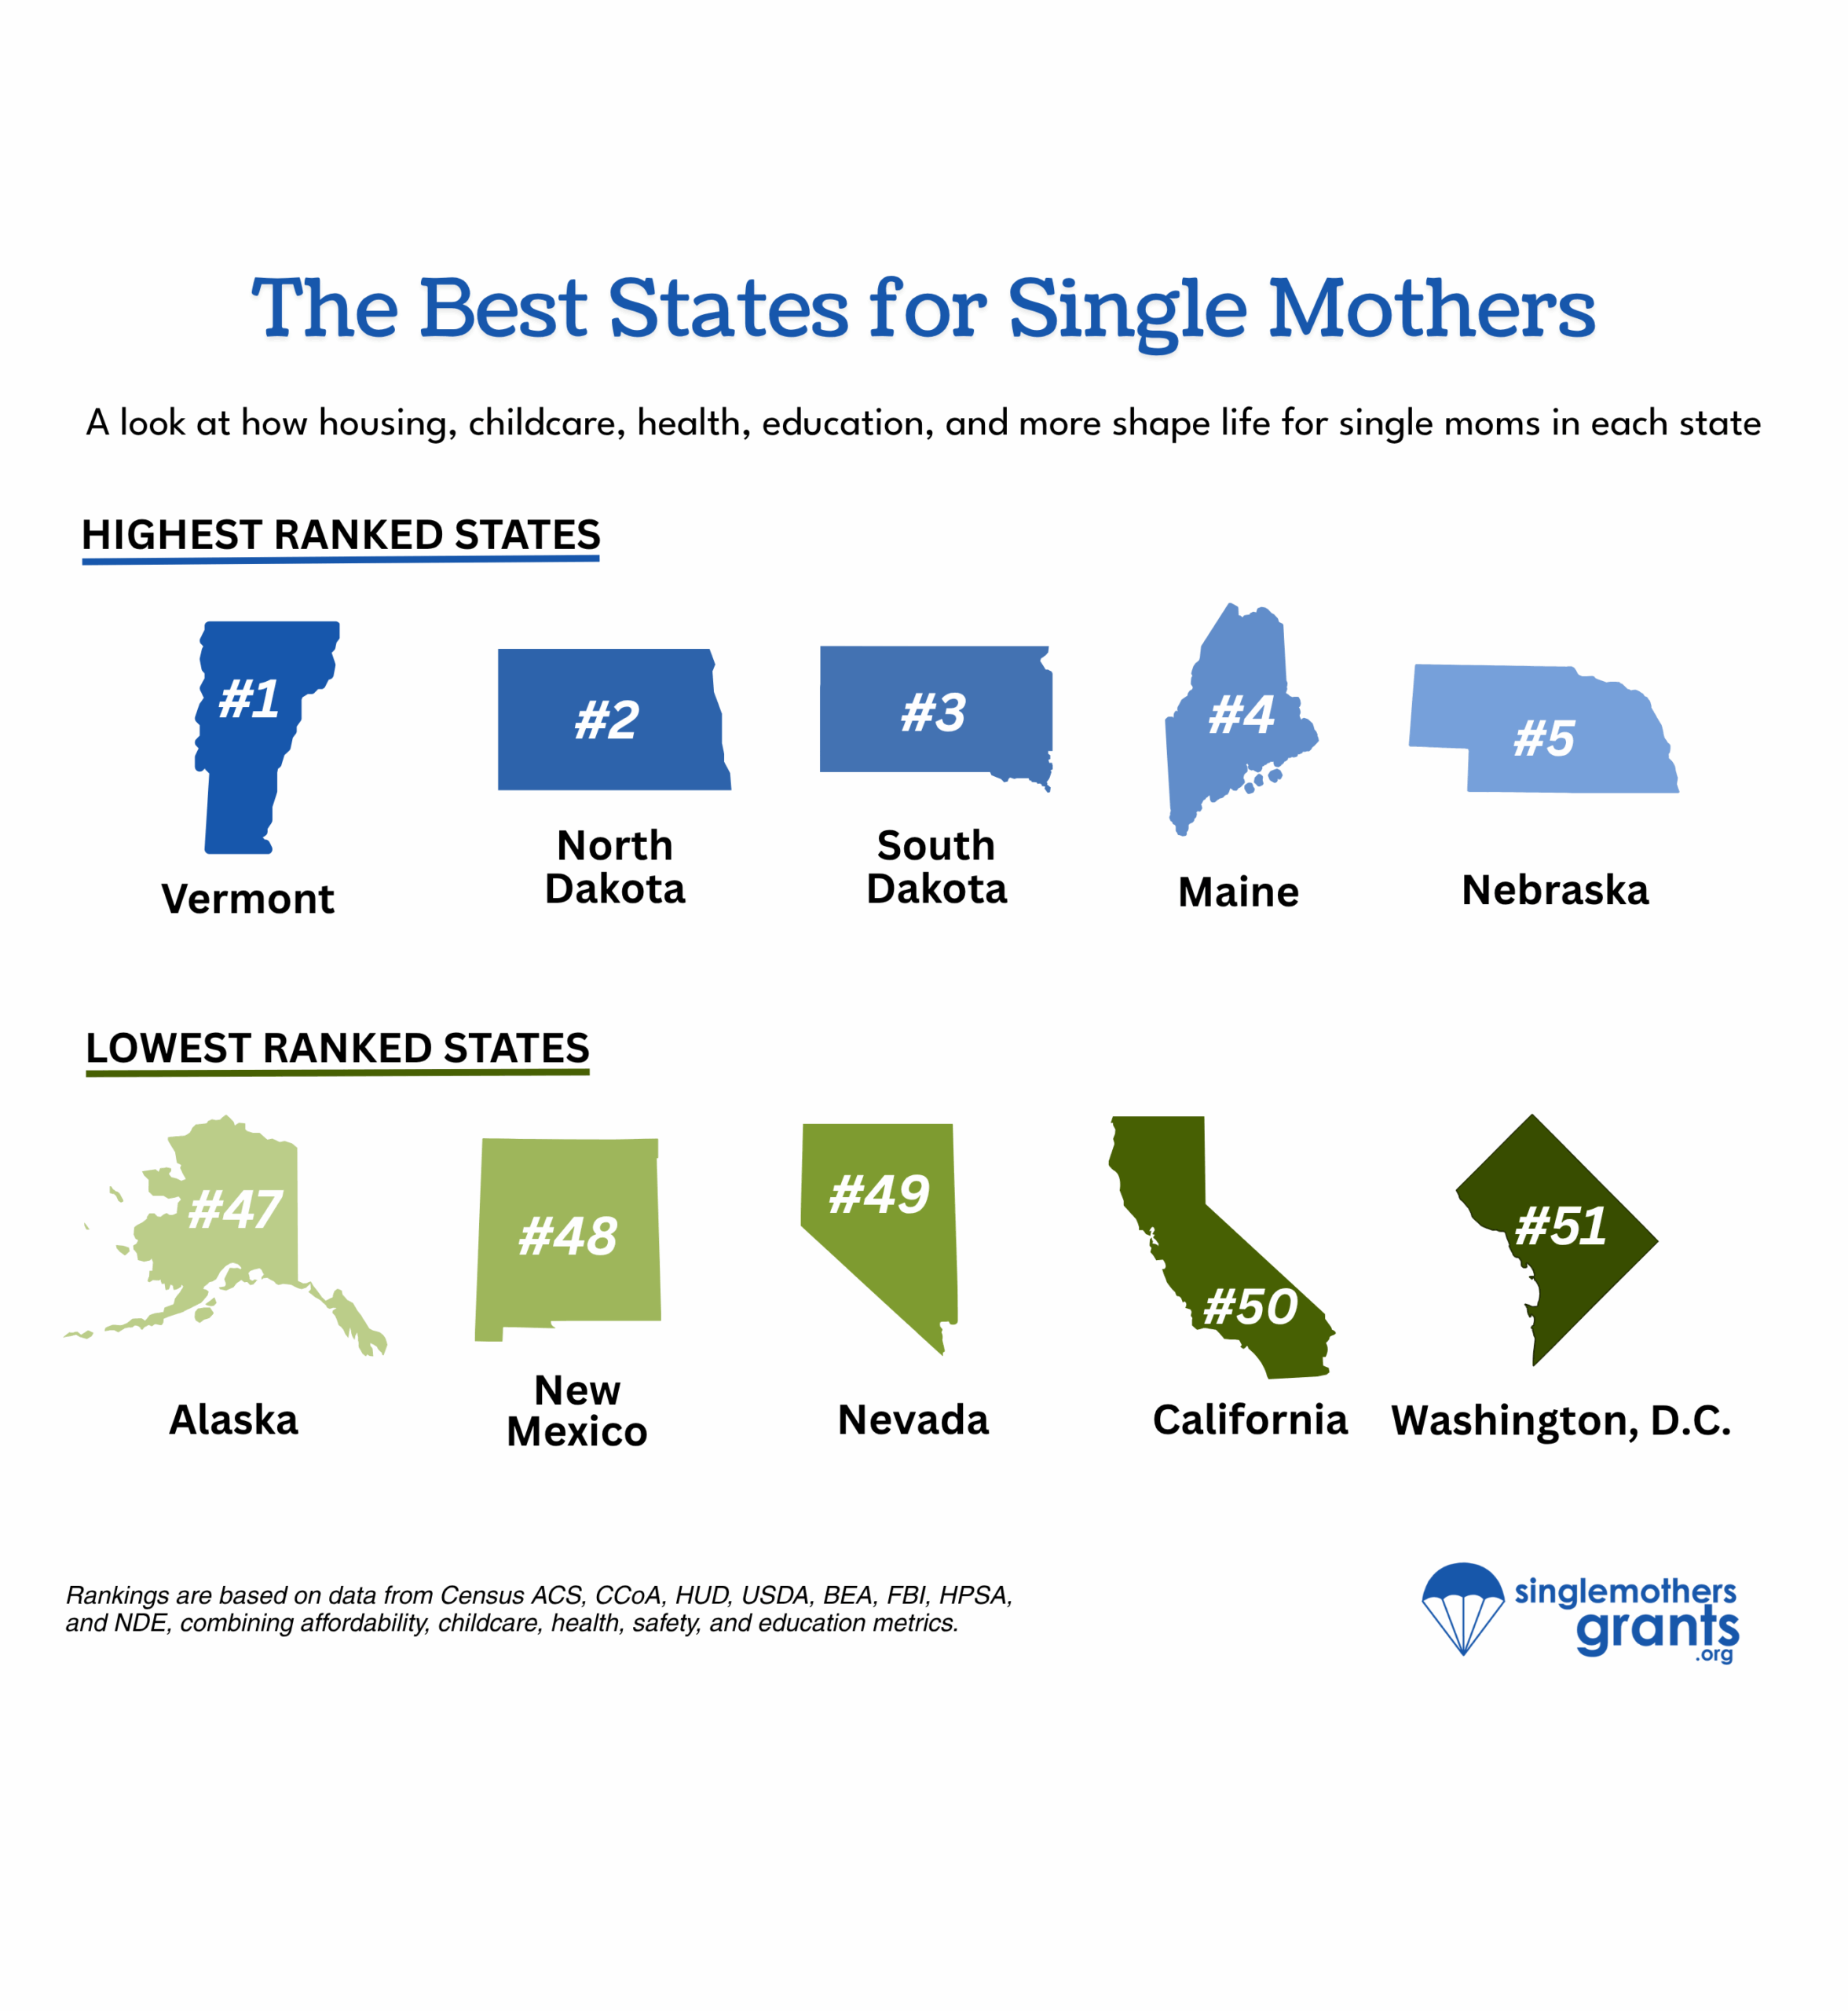
The bottom of the ranking tells the other side of the story. California, Nevada, New Mexico, Alaska, and D.C. have strengths, from world-class hospitals to strong test scores in some districts, but those wins are often overwhelmed by high rent and steep child care costs. So, while great schools are an incredible asset, if high taxes cause much of your take-home pay to vanish, it can be difficult to justify living in such a locale.
There are also sharp category contrasts worth noting. Massachusetts lands mid-table overall but leads in education. Mississippi offers some of the lowest child care prices, and Wyoming benefits from safer streets. For a single mom choosing a state, the best fit isn’t just the top overall rank, it’s the place that directly cuts her biggest stress in half, whether that’s the rent, the child care bill, or the sense that her block is safe and her kids’ school is solid.
Ranking the Best States for Single Moms in 2025
Practical guidance for single mothers weighing a move
- Do the “3 big bills” test. Add your likely rent, full-time child care price, and groceries. If that exceeds your expected take-home by more than half, the location will be tough to sustain.
- Check crime and school fit by neighborhood, not just city. The FBI Crime Data Explorer and district report cards help you compare specific areas.
- Analyze state leave and job-protection rules. These are published by the National Conference of State Legislatures. Even a short period of paid leave or job-protected time can prevent a crisis from becoming a catastrophe.
- Prioritize health access. Proximity to pediatricians, OB/GYNs, and mental health resources matters when you are the household’s only safety net.
Conclusion
Single mothers keep households running, raise the next generation, and prop up local economies, often without a safety net or a second income, which makes their time, health, and dignity non-negotiable. The best places for them aren’t just affordable, they’re supportive, with safe blocks, steady jobs, dependable child care, and schools that open doors.
But numbers can’t see everything. When choosing where to live, weigh the power of your own village, whether that’s nearby grandparents who can pinch-hit at pickup, a sister who can cover a late shift, a friend who swaps weekend care, or a faith or community group that shows up. A city that costs a little more but puts you closer to trusted people may beat a cheaper zip code that leaves you on an island. In the end, the right move is the one that protects your budget and strengthens your support, so you and your kids can breathe, grow, and look forward.
What’s Behind the Rankings?
1) Rent burden and income
We measure housing pressure with the Census Bureau’s 2024 American Community Survey. Median gross rent by bedrooms comes from table B25031, which lets us estimate a realistic rent burden for families with kids. To anchor affordability in real earnings, we pair this with table B19126 for median income of female householders, no spouse, with own children, in 2024 inflation-adjusted dollars.
2) Child care and education
Child care costs come from Child Care Aware’s 2024 “Price of Care” landscape, using annual prices for full-time center-based and family child care. To gauge likely demand and infant–toddler pressure on supply, we use ACS table B09001 for the number of children under age three. K–12 quality is captured with 2024 Nation’s Report Card results in reading and math so the ranking reflects both early care realities and long-term school outcomes.
3) Transportation and food costs
Getting to work, school, and care is a big budget line, so we include HUD’s 2023 Low Cost Transportation Index from the Location Affordability Index to estimate typical household transportation expenses. For groceries, we use USDA’s Thrifty Food Plan, December 2024, which provides an up-to-date, inflation-aware benchmark for monthly food costs.
4) Regional price levels
To make fair, cross-state comparisons, we adjust dollar figures with the Bureau of Economic Analysis’ Regional Price Parities. This normalizes for local price levels, so a dollar in Omaha is comparable to a dollar in San Jose.
5) Safety
We incorporate the FBI’s 2024 Crime Data Explorer (Summary Reporting System) to reflect personal safety and neighborhood risk. Safer environments matter for daily well-being and for practical things like late pickups, evening shifts, and outdoor play.
6) Health care access
Access to maternal and pediatric care is measured with HRSA’s Area Health Resources Files. We track pediatricians per 100,000 and OB/GYNs per 100,000 to capture how easy it is to find routine and specialized care for both kids and mothers.
7) Pulling it all together
All indicators are directionally aligned, scaled, and grouped into nine categories: rent burden, child care cost, child care program availability, transportation cost, food cost, unemployment, crime, health care access, and education. Category scores are then averaged into a composite for states and metros, giving a clear view of where a single paycheck can realistically cover the basics while supporting kids’ safety, health, and learning.
Fair Use
You’re welcome to share this study and our graphics for non-commercial purposes. Please credit the analysis and link back to this page so readers can review the full methodology and data sources.