




Study : The Single Mother Squeeze Index
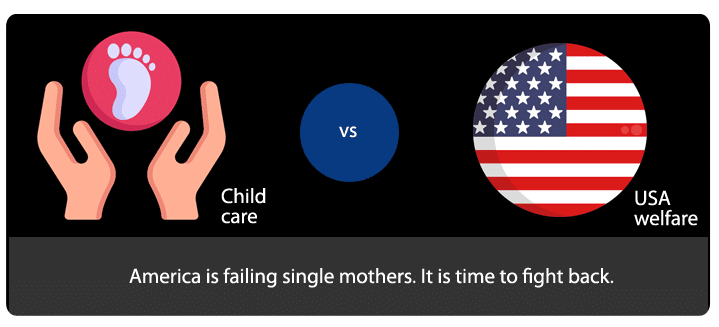
A state-by-state ranking of childcare costs against welfare support, built from federal childcare pricing data and state cash-assistance figures. Across the 50 states and Washington, D.C., all but one fail to provide a full year of welfare checks that covers a full year of child care.
Published Sep 10 2026 by Diane Miller, Senior writer | All 50 states + Washington, D.C. | Sources: Child Care Aware of America, National Center for Children in Poverty
Key findings
Ten figures pulled directly from the underlying data, covering the size of the gap between childcare costs and cash assistance across the country.
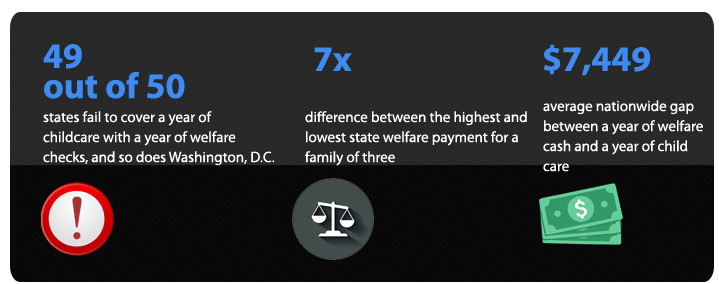
01. In 49 of the 50 states, plus Washington, D.C., a year of welfare checks won’t cover a year of daycare
Only in Wyoming does 12 months of TANF cash assistance add up to more than a year of infant care costs. Everywhere else, including every other state and Washington, D.C., it takes longer than a year of saved checks to cover 12 months of care. In Delaware and Missouri, it takes close to four years.
02. A single mother on welfare in Arkansas lives on $6.80 a day for her whole family
Arkansas pays $204 a month in cash assistance to a family of three, the lowest maximum benefit of any state.
03. Same federal program, seven times the money
Minnesota pays $1,430 a month in TANF cash assistance to a family of three. Arkansas pays $204. Both are the same program, run at the state level.
04. Six states pay less than $10 a day to a family of three
Arkansas, Mississippi, North Carolina, Georgia, Missouri and Oklahoma all cap TANF cash assistance under $300 a month total.
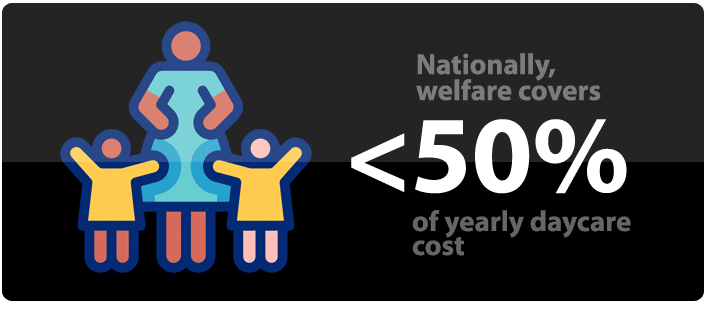
05. Nationally, welfare covers less than half of what a year of daycare costs
A full year of the average state’s TANF checks still falls $7,449 short of covering one year of infant care.
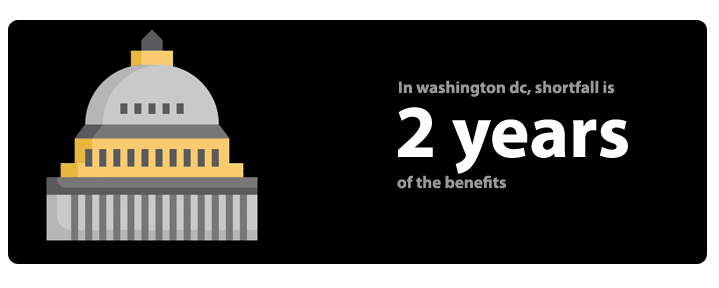
06. In Washington, D.C., the shortfall is worth almost two years of the benefit itself
A year of TANF cash in D.C. comes to $9,636. Infant care costs $28,356. The $18,720 gap is worth close to two years of the benefit.
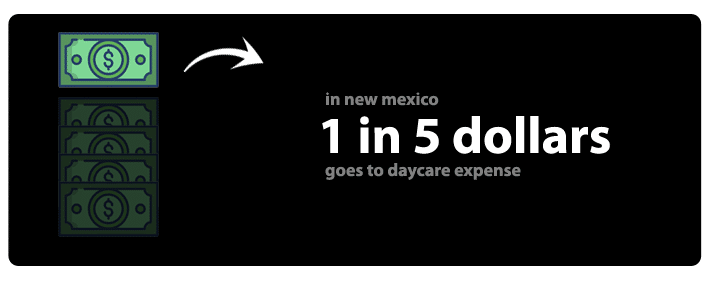
07. One in five dollars a New Mexico family earns goes on infant daycare alone
New Mexico families spend 21% of median family income on infant care before rent, food, gas or anything else. It’s the heaviest childcare burden of any state, and the reason it ranks first on the index.
08. It would take three years and eight months of Arkansas welfare checks to cover one year of daycare
At $204 a month, a family would need to save every single TANF payment for 43.5 months straight to match what one year of infant care costs there.
09. Seven states pay under 15 cents on the dollar of what the government defines as survival
Arkansas, Florida, Georgia, Mississippi, Missouri, North Carolina and Oklahoma all set their maximum TANF payment below 15% of the federal poverty line for a family of three.
10. The cheapest state for daycare still can’t close its own gap
Mississippi has the lowest sticker price for infant care in the US ($6,868/year), but its TANF check is so low ($260/month) that families there still can’t cover it without other help.
The full ranking
All 50 states plus Washington, D.C., ranked from most to least squeezed. Rank 1 = most squeezed.
| Rank | State | Infant care /yr | % of family income | Max TANF /mo (fam. of 3) | TANF % of poverty line | Squeeze score |
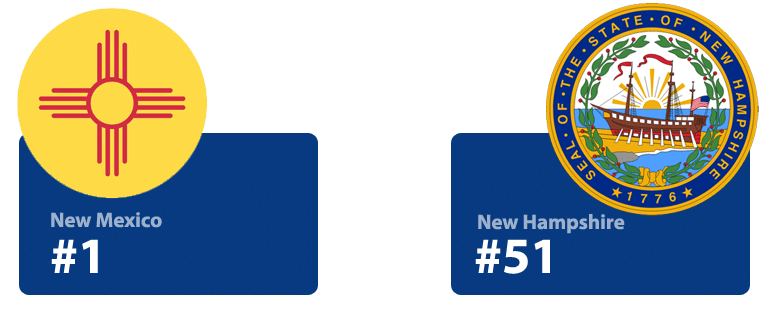
| 1 | New Mexico | $14,244 | 21.0% | $549 | 24.7% | 86.0 |
| 2 | Nevada | $15,950 | 18.3% | $386 | 17.4% | 80.8 |
| 3 | Oregon | $19,064 | 18.2% | $506 | 22.8% | 75.6 |
| 4 | Arizona | $15,625 | 16.5% | $347 | 15.6% | 74.9 |
| 5 | Oklahoma | $12,468 | 15.4% | $292 | 13.1% | 72.3 |
| 6 | Delaware | $16,220 | 15.7% | $338 | 15.2% | 71.8 |
| 7 | Alaska | $20,943 | 19.4% | $923 | 33.2% | 71.4 |
| 8 | Hawaii | $21,167 | 20.0% | $985 | 38.6% | 69.1 |
| 9 | Missouri | $13,173 | 14.6% | $292 | 13.1% | 68.8 |
| 10 | Ohio | $17,071 | 17.7% | $623 | 28.1% | 68.6 |
| 11 | Colorado | $21,840 | 17.9% | $649 | 29.2% | 68.4 |
| 12 | Florida | $13,021 | 14.1% | $303 | 13.6% | 66.2 |
| 13 | Indiana | $14,471 | 16.0% | $513 | 23.1% | 65.9 |
| 14 | Tennessee | $12,249 | 14.8% | $387 | 17.4% | 65.8 |
| 15 | Washington | $20,677 | 17.5% | $706 | 31.8% | 64.4 |
| 16 | Georgia | $11,863 | 13.0% | $280 | 12.6% | 62.4 |
| 17 | North Carolina | $11,720 | 12.8% | $272 | 12.2% | 62.0 |
| 18 | Massachusetts | $26,709 | 18.1% | $861 | 38.8% | 60.6 |
| 19 | Wisconsin | $16,956 | 16.0% | $653 | 29.4% | 60.3 |
| 20 | Arkansas | $8,873 | 11.5% | $204 | 9.2% | 59.2 |
| 21 | South Carolina | $11,512 | 13.7% | $449 | 20.2% | 58.4 |
| 22 | Pennsylvania | $13,354 | 13.3% | $421 | 19.0% | 57.8 |
| 23 | Nebraska | $14,106 | 14.3% | $584 | 26.3% | 55.7 |
| 24 | Vermont | $18,836 | 17.0% | $880 | 39.6% | 55.1 |
| 25 | Maryland | $18,946 | 15.6% | $753 | 33.9% | 54.4 |
| 26 | New York | $17,361 | 15.5% | $756 | 34.0% | 53.9 |
| 27 | West Virginia | $9,692 | 13.5% | $542 | 24.4% | 53.8 |
| 28 | Connecticut | $20,254 | 16.2% | $833 | 37.5% | 53.8 |
| 29 | Kentucky | $8,756 | 11.4% | $341 | 15.4% | 52.9 |
| 30 | Virginia | $14,277 | 13.1% | $559 | 25.2% | 51.5 |
| 31 | Texas | $10,706 | 11.6% | $405 | 18.2% | 51.3 |
| 32 | Idaho | $9,630 | 11.3% | $389 | 17.5% | 50.7 |
| 33 | Mississippi | $6,868 | 10.0% | $260 | 11.7% | 50.3 |
| 34 | Rhode Island | $16,758 | 15.7% | $865 | 38.9% | 50.2 |
| 35 | New Jersey | $18,155 | 13.0% | $599 | 27.0% | 49.4 |
| 36 | California | $21,945 | 18.4% | $1,175 | 52.9% | 49.3 |
| 37 | Montana | $12,778 | 13.8% | $725 | 32.6% | 47.9 |
| 38 | Illinois | $16,107 | 14.3% | $777 | 35.0% | 47.6 |
| 39 | Alabama | $7,871 | 9.8% | $344 | 15.5% | 46.2 |
| 40 | Utah | $13,094 | 12.8% | $662 | 29.8% | 45.8 |
| 41 | Iowa | $9,605 | 10.2% | $426 | 19.2% | 44.3 |
| 42 | Kansas | $9,105 | 10.1% | $429 | 19.3% | 43.8 |
| 43 | Louisiana | $8,873 | 10.5% | $484 | 21.8% | 43.5 |
| 44 | Michigan | $10,023 | 10.9% | $583 | 26.2% | 41.2 |
| 45 | Minnesota | $22,569 | 18.8% | $1,430 | 64.4% | 40.4 |
| 46 | Maine | $13,310 | 13.6% | $917 | 41.3% | 39.2 |
| 47 | District of Columbia | $28,356 | 11.8% | $803 | 36.2% | 35.9 |
| 48 | South Dakota | $8,680 | 9.4% | $626 | 28.2% | 32.8 |
| 49 | Wyoming | $9,327 | 11.1% | $920 | 41.4% | 28.1 |
| 50 | North Dakota | $12,373 | 10.9% | $916 | 41.2% | 27.5 |
| 51 | New Hampshire | $17,364 | 13.4% | $1,329 | 59.8% | 21.5 |
 Squeeze score averages a normalised childcare-burden score and a normalised safety-net-inadequacy score, each on a 0–100 scale. Full calculation in the methodology below.
Methodology
| What the index measures
The Single Mother Squeeze Index scores each state and Washington, D.C. on two equally weighted factors: 1. Childcare burden: the annual cost of infant, center-based childcare as a percentage of that state’s median family income (2025). 2. Safety-net inadequacy: how far a state’s maximum TANF cash benefit for a family of three falls below the Federal Poverty Level (2025/26), inverted so a low benefit produces a high (worse) score. Each factor is min-max normalised to a 0–100 scale across all 50 states and Washington, D.C. (51 jurisdictions in total), then averaged into a single Squeeze Index score. Jurisdictions are ranked from 1 (most squeezed) to 51 (least squeezed). Known limitation: the childcare-cost share uses overall median family income, not single-mother household income specifically, because that is the income figure published in the source data. A future version could substitute Census ACS Table S1702 (poverty status of families) for a single-mother-income-specific figure. Data verification note: all figures were checked directly against primary sources in September 2026. Two states’ TANF benefits changed during 2025 and this analysis uses the current, post-change amounts: Kentucky reduced its maximum benefit from $524 to $341 in November 2025, and South Dakota reduced its benefit from $696 to $626 in August 2025 as the first phase of a rolling cut the state plans to continue over several years. Because South Dakota’s figure may fall further in future years, readers citing this study after 2026 should reverify that figure against NCCP’s then-current release. |
Sources
Childcare cost & median family income: Child Care Aware of America / Economic Policy Institute, compiled by World Population Review, February 2025.
TANF maximum benefit & % of Federal Poverty Level: National Center for Children in Poverty, “TANF Cash Assistance Maximum Benefit Amounts (2025/26),” May 2026.
Data compiled and published by singlemothersgrants.org. For interview requests or the full dataset, contact https://singlemothersgrants.org/contact-us/